|
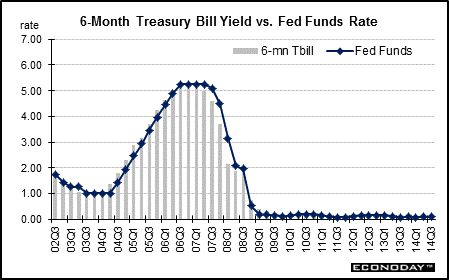
Long Term Perspective The spread between the 6-month Treasury bill and the federal funds rate is negative when the yield on the 6-month bill is lower than the fed funds rate. In the 1980s, this spread averaged minus 25 basis points, but averaged zero basis points in the 1990s.
Between 2000 and 2013, the yield on the 6-month Treasury bill was almost identical to the federal funds rate, on average, with this fourteen year average spread at minus 4 basis points. It is worth noting that the average spread was somewhat different in 2004 and 2005 when the 6-month bill yield was roughly 25 to 30 basis points higher than the fed funds rate, reflecting an expectation at that time of further Fed tightening. Just earlier, the spread was negative, anticipating Fed rate cutting.
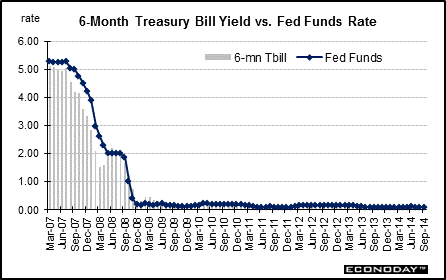
Short Term Perspective From late 2006 into early 2008, the fed funds rate topped the 6-month bill rate, indicating an expectation of lower fed funds rates ahead. The markets continually had been disappointed on that count until the September 18, 2007 cut in the fed funds target rate and subsequent cuts. But when the Fed began its quantitative easing in earnest in October 2008 (followed by setting the fed funds target at zero to 0.25 percent on December 16, 2008), the effective fed funds rate dropped below the 6-month T-bill. However, expectations of a near-zero fed funds rate through at least late 2015 (based on Fed officials' forecasts and fed funds futures) have pulled the 6-month T-bill down to essentially match the fed funds rate.
The average yield for the 6-month T-bill in September 2014 was down 1 basis point to 0.04 percent.
Values shown reflect monthly averages.
|
|||||||
| Legal Notices | ©Copyright 1998-2024 Econoday, Inc. |
powered by
![[Apple App Store]](/images/AppleAppStore.png) ![[Econoday on Kindle]](/images/kindle.jpg) 
|
||||||