|
Long Term Perspective
This index is based on 500 companies with capitalization ranging from $1 billion to $600 billion, according to S&P. This index captures 75 percent coverage of U.S. equities.
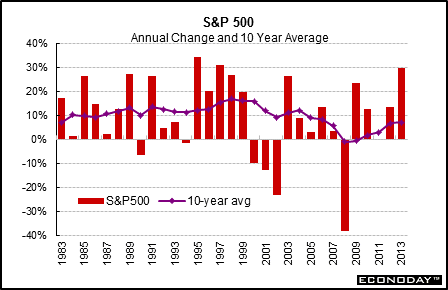
The S&P 500 surged 29.6 percent in 2013 after a gain of 13.4 percent the year before. The S&P 500 outpaced the Dow for both years. The 10-year average for the S&P 500 improved to 7.0 percent from 6.7 percent in 2012.
Short Term Perspective
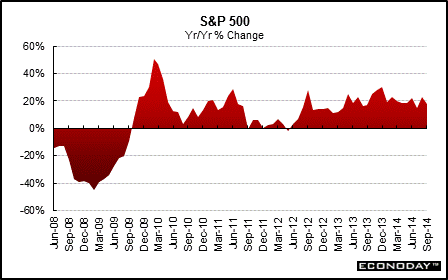
The S&P 500 waned on a year-over-year basis in latter 2007 and into 2009 due to subprime concerns, the credit crunch, and recession. An improved recovery boosted stocks in 2010 though worries about Europe were off and on. A slowing economy added to revenue concerns in 2012 but cost cutting kept profits and equities up net for 2012. After a healthy uptrend in early 2013, stocks were volatile during mid-year and into 2014. Worries about slower economic growth and possibly early Fed tapering were behind the swings along with on and off worries about Ukraine and, later, Gaza. The S&P 500 in September had a year-ago increase of 17.3 percent, compared to 22.7 percent the month before.
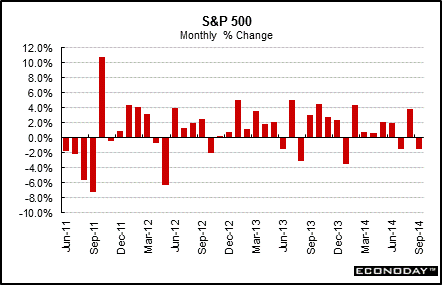
On a monthly basis, the S&P 500 declined 1.6 percent in September after increasing 3.8 percent the month before
|
|||||||
| Legal Notices | ©Copyright 1998-2024 Econoday, Inc. |
powered by
![[Econoday]](images/logo.gif)
![[Apple App Store]](/images/AppleAppStore.png) ![[Econoday on Kindle]](/images/kindle.jpg) 
|
||||||


