|
Long Term Perspective
The Mid Cap series is relatively new to the S&P family. The index consists of 400 domestic stocks chosen for market size, liquidity, and industry group representation. It includes industrials, financials, utilities and transportation just like the S&P 500. The difference is that the market cap of these companies is smaller than for the 500 index. To be included in the index, a stock must have a total market capitalization that ranges from about $500 million to $10 billion dollars. Estimates do vary, however. This index of 400 companies covers about 7 percent of the U.S. equities market.
The Mid Cap index incorporates a greater portion of its companies listed from the NASDAQ compared to the S&P 500. NASDAQ companies tend to be younger than those listed on the New York Stock Exchange (NYSE). Generally, companies in the Mid Cap index tend to grow faster than the more mature companies in the S&P 500. But the risk is greater.
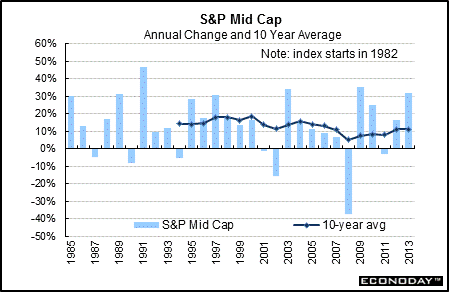
This index of mid-cap stocks jumped 31.6 percent in 2013, following a 16.1 percent boost in 2012. The 10-year average came in at 10.9 percent, down slightly from 11.2 percent in 2012.
Short Term Perspective
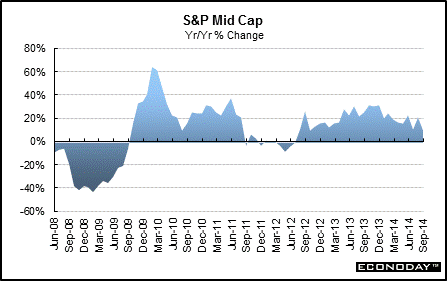
The Mid Cap index was up 10.2 percent in September on a year-ago basis, compared to 21.5 percent the prior month.
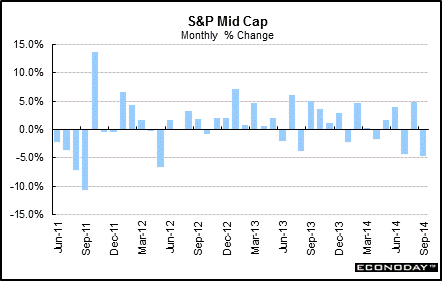
The Mid Cap fell 4.7 percent in September after rebounding 4.9 percent the prior month.
|
|||||||
| Legal Notices | ©Copyright 1998-2025 Econoday, Inc. |
powered by
![[Econoday]](images/logo.gif)
![[Apple App Store]](/images/AppleAppStore.png) ![[Econoday on Kindle]](/images/kindle.jpg) 
|
||||||


