|
Long Term Perspective
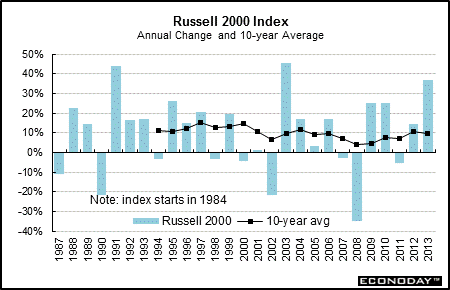
The Russell 2000 surged 37.0 percent in 2013 after rebounding 14.6 percent in 2012. The 10-year average eased to 9.6 percent in 2013 from 10.5 percent the year before. The Russell 2000 is a benchmark index for the small capitalization sector. It has a longer history than the S&P Small Cap Index and also has a wider base (2000 stocks versus 600 for the S&P).
Short Term Perspective
Small cap stocks seem to get hit more dramatically than large cap stocks in times of uncertainty but they also tend to rebound more sharply in economic recovery. This index gets revised each year in July when stocks no longer fitting the "small-cap" criterion are removed from the index.
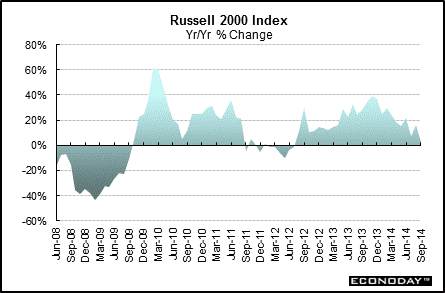
In early 2012, perceived progress on European debt, favorable corporate earnings, and mostly positive economic data boosted small caps. But at mid-year, European worries were off and on and the economy was slowing. Fiscal cliff concerns also weighed on stocks. But at the start of 2013, an improving economy helped lift equities—until worries about Fed tapering set in during mid-year. Lessened worries on the impact of tapering added lift to this sector. A softer economy and Ukraine issues weighed on stocks in 2014—plus global slowing. On a year-ago basis, the Russell 2000 in September came in at 2.6 percent, compared to 16.2 percent the month before.
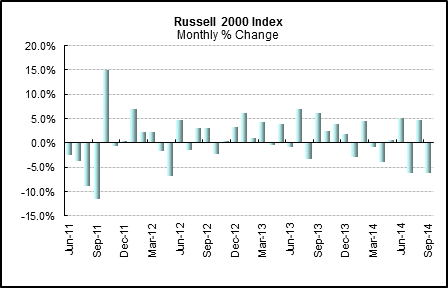
The Russell 2000 fell 6.2 percent in September after rebounding 4.8 percent in August.
|
|||||||
| Legal Notices | ©Copyright 1998-2025 Econoday, Inc. |
powered by
![[Econoday]](images/logo.gif)
![[Apple App Store]](/images/AppleAppStore.png) ![[Econoday on Kindle]](/images/kindle.jpg) 
|
||||||


