|
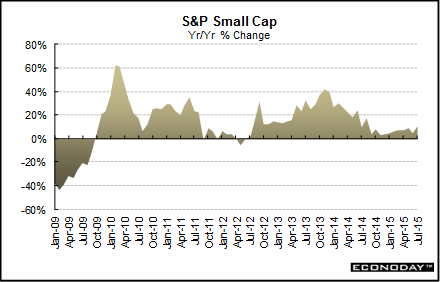
Long Term Perspective
Small Cap stocks have historically shown greater returns than large cap stocks. This is a new index in the S&P family, but the Russell 2000 has a longer history and also measures the small cap sector. Market capitalization roughly ranges from $20 million to $3 billion. This index of 600 companies covers about 3 percent of the U.S. equities market.
Just like the S&P 500 and the Midcap, the Small Cap index includes industrials, utilities, financials and transportation. A larger portion of the companies in this index is from the Nasdaq than for the other two index measures.
The S&P Small Cap index grew 4.4 percent in 2014 after spiking 39.7 percent in 2013. The ten-year average posted at 9.5 percent, compared to 11.2 percent in 2013.
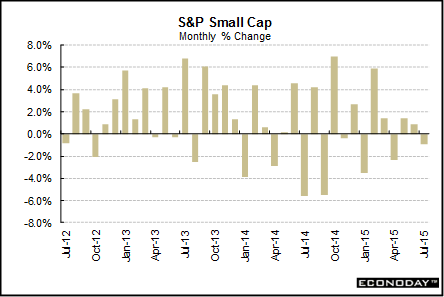
Short Term Perspective
The Small Cap index was up 10.5 percent in July from the prior year after increasing 5.3 percent in June.
The Small Cap index declined 0.9 percent in July after adding 0.9 percent in June. The index declined in January, April and July while increasing in the remaining months.
|
|||||||
| Legal Notices | ©Copyright 1998-2025 Econoday, Inc. |
powered by
![[Apple App Store]](/images/AppleAppStore.png) ![[Econoday on Kindle]](/images/kindle.jpg) 
|
||||||