|
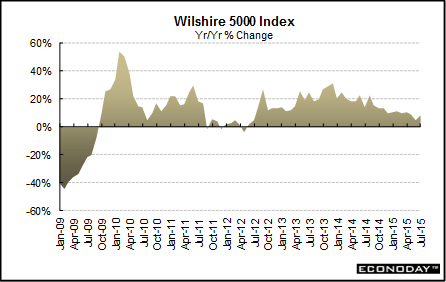
Long Term Perspective
The Wilshire 5000 is the most comprehensive of market indicators. It includes all publicly traded U.S.-based companies – now more than 7000. The Wilshire 5000 until mid-2009 had an association with the Dow Jones companies but switched to an association with Nasdaq. Dow Jones now calculates a comprehensive index intended to match the methodology of the Wilshire 5000 (but does differ slightly). It is called the Dow Jones Total Stock Market Index. However, the official Wilshire 5000 (from the Nasdaq site) continues to be referenced here.
The Wilshire 5000 advanced 10.0 in 2014 after jumping 31.4 percent in 2013. The 10-year average was steady at 8.0 percent, compared to 8.1 percent in 2013.
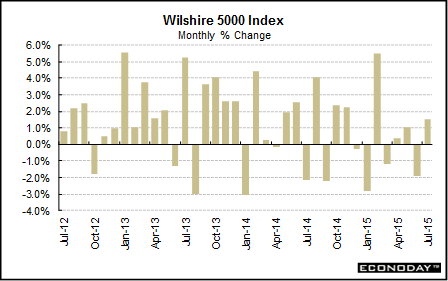
Short Term Perspective
The Wilshire 5000 is widely monitored by Fed officials because this index indicates the pattern of consumer wealth, reflecting changes in the broad equities market. The "wealth effect" is the concept that consumers are more likely to spend more money on goods and services when the stock market is appreciating. Conversely, consumers could curtail spending when the stock market is declining.
The Wilshire 5000 added 8.7 percent in July when compared to the same month a year ago after increasing 4.7 percent in June.
The Wilshire 5000 added 1.5 percent in July after swooning 1.9 percent the month before. So far this year, the index has retreated three months (January, March and June) but increased in the remaining four months.
|
|||||||
| Legal Notices | ©Copyright 1998-2025 Econoday, Inc. |
powered by
![[Apple App Store]](/images/AppleAppStore.png) ![[Econoday on Kindle]](/images/kindle.jpg) 
|
||||||