|
Long Term Perspective One of the Fed's two mandates is to maintain price stability. Therefore, inflation is always a key indicator among Fed officials. The consumer price index (CPI) is the most common inflation measure, but Federal Reserve officials prefer the personal consumption expenditure (PCE) price index. Fed officials believe the latter is more representative of changes in the actual cost-of-living. In order to remove inherent volatility in the price index coming from energy and food prices, these items are excluded and the resulting index (whether the CPI or the PCE price index) is called the "core" inflation rate.
It is important to remember that the PCE price index incorporates most of the CPI components. Nonetheless, it often shows less inflation than the CPI because it takes into account the fact that consumers tend to substitute lower priced goods for higher priced goods as relative prices change. The CPI measures a fixed basket of goods and services, and does not allow for substitutions, thereby typically overestimating actual prices paid by consumers in their purchases.
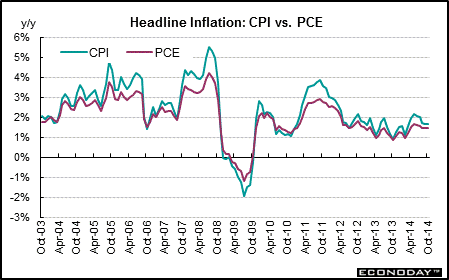
During early 2009, the CPI fell more than the PCE price index, likely due to the CPI having higher weights for gasoline and heating oil than the PCE index. It then grew faster than the PCE price index for the same reason during latter 2009. The two were at similar growth rates in 2010 and into early 2011. The CPI outpaced the PCE price index during the second half of 2011 and into mid-2014.
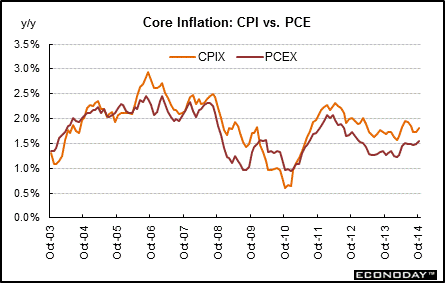
The widening and narrowing of the gap between the core CPI and the core PCE price index reveals shifts in the composition of goods and services actually purchased by consumers. Over the 10-year time horizon depicted in the chart, it is more likely than not to see a notable gap between the CPI and the PCE price index. Over the long run, core CPI inflation averages about three-tenths to four-tenths of a percentage point higher than for the core PCE—due partly to the fact that PCE component weights are updated each year while those for the CPI are updated only about every ten years. Recently, the gap has been larger.
Note: CPIX and PCEX in the chart legends refer to the core measures of the CPI and the PCE price index which exclude food and energy components.
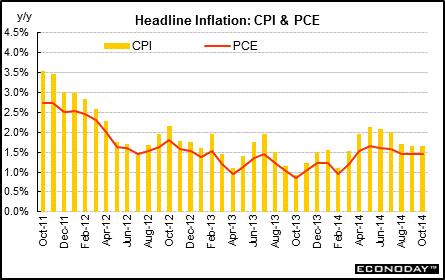
Short Term Perspective In late 2009 and early 2010, various Fed officials indicated that they should not just be concerned about "core" inflation—which excludes food and energy—but also overall inflation. The following chart depicts the year-over-year change in the headline inflation rate of the CPI and PCE price index.
Headline inflation rose sharply over the second half of 2007 and into mid-2008. During the second half of 2008 and into 2009, inflation eased sharply due to lower oil prices and the recession cutting into demand. After a bump up during latter 2009 and early 2010, oil and energy costs eased during mid-2010 but firmed again in late 2010 and early 2011. Energy rose significantly in mid-2013. An easing in shelter cost inflation weighed on overall numbers in 2010 but rose in 2011 and into mid-2014. As of October 2014, the headline CPI on a year-on-year basis was up 1.7 percent, compared to up 1.7 percent the month before. The PCE price index in October came in at up 1.4 percent, matching the pace in September.
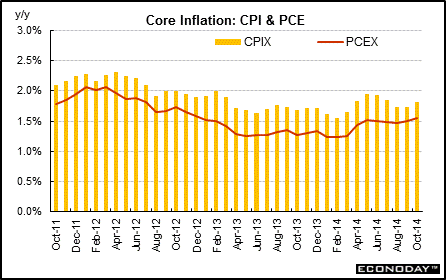
Turning to inflation excluding food and energy, as of October 2014, the core CPI on a year-on-year basis was 1.8 percent, following 1.7 percent in September. The core PCE price index inflation rate for October came in at 1.6 percent, compared to 1.5 percent in September.
Note: CPIX and PCEX in the chart legends refer to the core measures of the CPI and the PCE price index which exclude food and energy components.
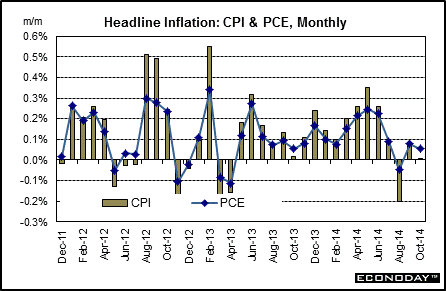
Overall consumer prices in October were a flat 0.0 percent after firming 0.1 percent in September. Market expectations were for a 0.1 percent dip. Energy fell 1.9 percent after slipping 0.7 percent September. Gasoline dropped 3.0 percent after declining 1.0 percent the month before. Food price inflation rose 0.1 percent, following a gain of 0.3 percent in September.
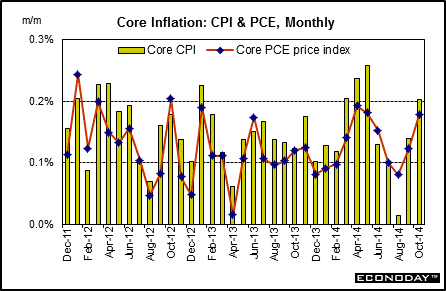
The PCE price index rose 0.1 percent in October, matching the pace for the month before.
Excluding food and energy, the CPI was warmer, gaining 0.2 percent after nudging up 0.1 percent in September. For the core rate, the shelter index, airline fares, household furnishings and operations, medical care, recreation, personal care, tobacco, and new vehicles were among the indexes that increased. The indexes for used cars and trucks and for apparel declined in October.
|
|||||||
| Legal Notices | ©Copyright 1998-2025 Econoday, Inc. |
powered by
![[Econoday]](images/logo.gif)
![[Apple App Store]](/images/AppleAppStore.png) ![[Econoday on Kindle]](/images/kindle.jpg) 
|
||||||
