|
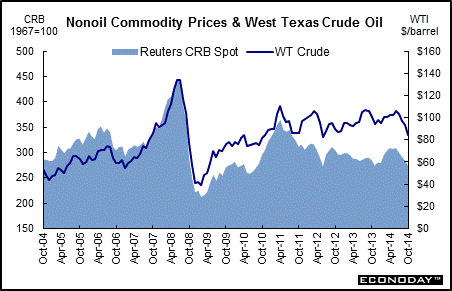
Long Term Perspective Since the Fed is so keen on keeping inflation low, the Fed cannot simply wait until monthly data on the consumer price index or the PCE price index are showing a boost in inflation. Consequently, Fed officials closely monitor commodity prices of all stripes. In addition to giving clues on inflation trends, changes in commodity prices reveal strength or weakness in economic activity as well. When commodity prices are rising rapidly, this often suggests that industrial activity is picking up steam. Conversely, when commodity prices are falling, industrial activity might be waning. The chart below depicts a spot commodity index that does not include any energy prices.
Oil is important to all facets of our life and thus oil prices are a key indicator that could signal potential inflationary pressures – or changes in economic growth. The economy often moderates in response to rapidly rising oil prices – and each of the recessions since 1971 have been preceded by an oil price shock. The 1970s Fed was blamed for exacerbating the inflation spiral by an overly accommodative policy during the oil embargo. Since then, the Fed has operated more carefully when sharp oil price changes have caused the U.S. economy to jump up and take notice.
Crude oil prices rose sharply during the first half of 2008 into early July of that year. Record highs were set during this period due to strong world-wide demand, a drop in the dollar, heavy speculation, and occasional reminders of political instability in some oil-producing regions such as Nigeria as well as saber rattling between the U.S. and Iran. On July 3, 2008 the spot price for West Texas Intermediate reached a then record high settle of $145.29 per barrel. A rise in the exchange value of the dollar has also helped oil prices to ease.
Recession worries pushed prices down during latter 2008 and early 2009. But recovery in the U.S. and Europe and strong demand from Asia pushed oil prices back up in 2010 and into early 2011. Demand for commodities strengthened notably over that period. Oil also was boosted by supply concerns from civil war in Libya and other civil unrest in North Africa and the Middle East.
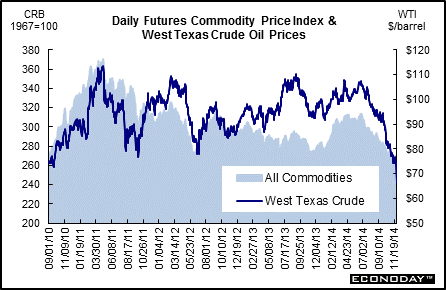
Short Term Perspective The futures commodity price index depicted here includes unleaded gasoline prices, but it is the only energy component among industrials, grains, livestock & meat and precious metal prices. Notice that this index does not always move in sync with crude oil prices. However, it is not unusual to see many types of commodity prices move in tandem since the same economic environment often affects them.
In mid-2011, sluggish economic data and worries about sovereign debt in Europe softened oil and commodities prices. Belief in progress in solving European sovereign debt problems and net favorable economic news bumped up oil late 2011 and very early 2012. During part of latter 2012, weaker economic news in the U.S. and fears of recession in Europe (on sovereign debt problems) tugged down on both oil and commodities overall. Better economic news and soft oil supply boosted crude prices in late 2012 and very early 2013. But in spring 2013, recession in Europe and slower growth in Asia weighed on crude prices and commodities. But in mid-2013, supply issues and lessening of worries over potential Fed tapering boosted prices notably. Soft growth in Europe and rising supply weighed on prices in latter 2013. Supply constraints led prices up in early 2014. But prices dropped in late 2014 on an easing of tensions between Ukraine and Russia, on slower growth in Europe and Asia, and notably on increased shale production in the U.S. As of November 28, 2014, the spot price of West Texas Intermediate stood at $66.15 per barrel. The RJ/CRB commodity futures index for the same period was down about 7 percent on a year-ago basis.
|
|||||||
| Legal Notices | ©Copyright 1998-2025 Econoday, Inc. |
powered by
![[Apple App Store]](/images/AppleAppStore.png) ![[Econoday on Kindle]](/images/kindle.jpg) 
|
||||||