|
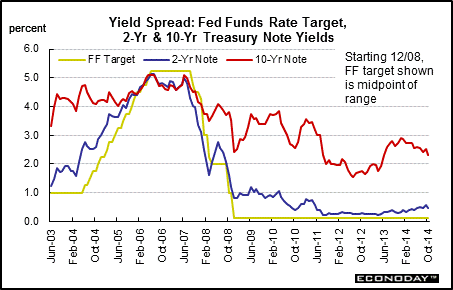
Long Term Perspective Fluctuating yield differentials between the 2-year note and the 10-year note reflect changes in the economic environment. When the spread between these two securities has narrowed, it has historically reflected softening in economic activity – and sometimes even recession. When the spread widens, it reflects a period of stronger economic growth. The gap between 10-year and 2-year note yields widened in 2002 and 2003 suggesting economic growth was on the horizon. In 2004, the gap narrowed as the yield curve flattened. The spread narrowed further in 2005 and 2006 and has been nonexistent during 2007 with the 2-year note even edging incrementally above the 10-year yield. Flight to quality over subprime concerns during the second half of 2007 kept rates low along with the belief that the Fed would be easing further. But in mid-2008, some market participants became skeptical of the Fed's inflation fighting resolve and long rates temporarily headed back up. During the second half of 2008, rate slashing by the Fed, recession, and flight to safety were the reasons rates fell. But during 2009, long rates reversed and headed back up on supply concerns related to funding the federal deficit. During 2010 and 2011, the 2-year and 10-year Treasury yields swung sharply due to on and off flight to safety on worries over European sovereign debt. These rates leveled off at low levels in late 2011 and 2012 due to the Fed's extension of guidance to at least mid-2015 but then switched to until the unemployment rate declines to 6.5 percent. But for the March 19, 2014 FOMC statement, the Fed removed a specific unemployment rate from guidance.
The Fed's current rate cutting cycle began in autumn 2007. In the latest rate-cutting cycle, the Fed cut the fed funds target rate from 5.25 percent in mid-2007 to a target range of zero to 0.25 percent set December 16, 2008 and has kept the target there through the October 28-29 FOMC meeting.
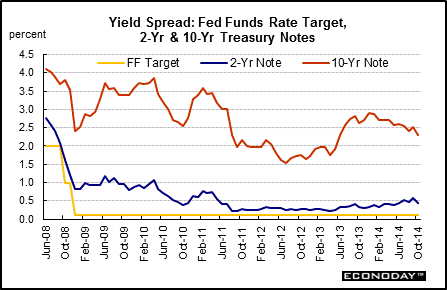
Short Term Perspective Typically, monthly averages for Treasuries come out with a modest lag and on a monthly average basis. Early in 2011, rates on longer maturity Treasuries increased due to a strengthened recovery, an easing of worries over sovereign debt in Europe, higher commodities prices, and concern that the Fed will not extend quantitative easing beyond June 2011. But in 2011 and 2012, soft economic data and renewed worries about European sovereign debt bumped longer maturity rates down somewhat. The Fed's pledge to keep policy rates exceptionally low weighed on rates with flight to safety on European concerns. In late 2012 and very early 2013, improved economic news led long rates to firm. In spring 2013, longer rates eased on softer economic indicators. But long rates rose significantly on market chatter that the Fed might taper asset purchases in autumn 2013. Long rates rose further in early 2014 after the announcement of taper in December 2013 and reaffirmation at subsequent FOMC meetings in 2014. But in late 2014, rates eased on softer global growth and flight to safety over geopolitical events. In October, the yield on the 2-year note was down 12 basis points for the month to 0.45 percent while the 10-year bond rate declined 23 basis points to 2.30 percent.
|
|||||||
| Legal Notices | ©Copyright 1998-2025 Econoday, Inc. |
powered by
![[Apple App Store]](/images/AppleAppStore.png) ![[Econoday on Kindle]](/images/kindle.jpg) 
|
||||||