|
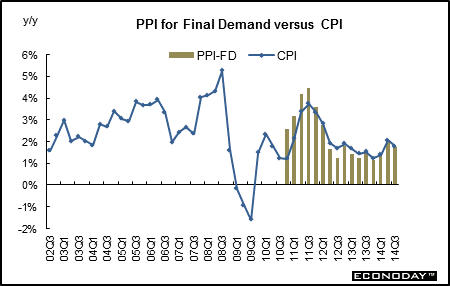
Long Term Perspective Late in 2006, the CPI slowed with lower oil prices pulling down the overall growth rate with upward pressure from energy in 2007 through early 2008 and downward pressure in late 2008 and 2009. Strong services inflation kept the CPI up while the slowing economy had more impact on the PPI which does not have services. Higher oil prices in 2011 boosted inflation for both series. Weak shelter cost inflation also weighed the CPI down until latter 2011. With the redefined PPI, the two series more closely track each other since the PPI now includes services which are less volatile than goods prices.
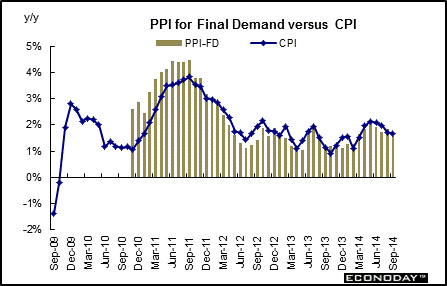
Short Term Perspective Oil prices picked up in 2011 but were not yet showing up on a year-ago basis but softened in late 2011. In spring and summer 2013, crude rose significantly, putting upward pressure on the headline CPI and headline PPI. Crude leveled off on average in latter 2013 and showed moderate volatility into 2014 and weakened notably in mid-2014. For September 2014, on a year-on-year basis, the overall PPI for final demand was up 1.6 percent while that for the CPI was up 1.7 percent.
|
|||||||
| Legal Notices | ©Copyright 1998-2024 Econoday, Inc. |
powered by
![[Apple App Store]](/images/AppleAppStore.png) ![[Econoday on Kindle]](/images/kindle.jpg) 
|
||||||