|
Gross domestic product — The service sector dominates the Australian economy accounting for about 68 percent of gross domestic product. But its agricultural and mining sectors, which combined account for only 8 percent of GDP account for 65 percent of its exports. Manufacturing accounts for less than 12 percent of GDP. Australia is a major exporter of agricultural products, particularly grains and wool, and minerals including various metals, coal and natural gas. A downturn in world commodity prices can thus have a large impact on the economy. Australia's competitive advantage in primary products is a reflection of the natural wealth of the Australian continent and its small domestic market. Just over 22 million people occupy a continent the size of the contiguous United States.
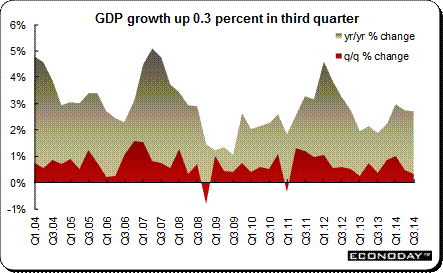
GDP increased 0.5 percent in the second quarter, down from 1.1 percent in the first quarter of 2014. On the year, GDP growth eased to 3.1 percent from 3.4 percent. The 3.4 percent annual gain in the first quarter was regarded as exceptionally high due to a quirk in how Australian statisticians seasonally adjust mining output. Clement weather flattered how the contribution from the nation's mining industry was measured during what is traditionally a poor quarter.
Third quarter GDP edged up 0.3 percent and was up 2.7 percent on the year. On the expenditure side, the increase was driven by final consumption expenditure (0.4 percentage points) and net exports (0.8 percentage points). These increases were partially offset by decreases in private gross fixed capital formation (down 0.5 percentage points) and public gross fixed capital formation (down 0.2 percentage points).
On the year, mining (0.9 percentage points), financial and insurance services (0.5 percentage points) and construction (0.3 percentage points) industries were the largest contributors to total trend growth of 2.7 percent. Professional, scientific & technical services (down 0.4 percentage points), agriculture, forestry & fishing (down 0.2 percentage points) and transport, postal & warehousing (down 0.2 percentage points) were the largest detractors in trend terms.
Like Canada, and unlike the U.S., UK and Europe, Australia releases GDP data once a quarter, usually about two or more months after the reference quarter's end and is usually the last of the major industrial countries to do so.
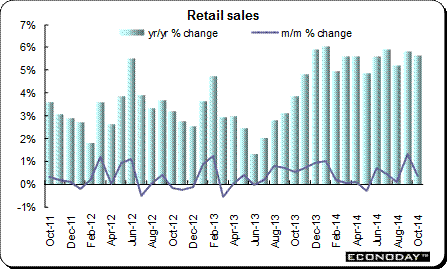
Retail sales — Like all consumer based economies, retail sales data provide a more current look at the sector's health. Sales were dampened by the RBA's three interest rate increases in 2009. Early in 2011, sales weakened as the interest rate increases began to bite. The RBA had increased rates seven times and retail sales continue to show the impact. The Queensland floods also put a dent into sales. The RBA eased interest rates in an attempt to rebalance the economy away from mining to other parts of the economy. From May 2012, the RBA reduced its key interest rate in a series of 25 basis points moves to its current 2.5 percent.
October retail sales were up a greater than anticipated 0.4 percent. On the year, retail turnover was up 5.7 percent when compared with the same month a year ago. Household goods retailing was up 1.4 percent, food retailing (0.5 percent), department stores (2.0 percent), clothing, footwear & personal accessory retailing (1.1 percent) and other retailing (0.2 percent). This was partially offset by a decline in cafes, restaurants & takeaway food services (down 2.1 percent). Total online retail trade, in original terms, increased 9.5 percent in October following a gain of 8.7 percent in September.
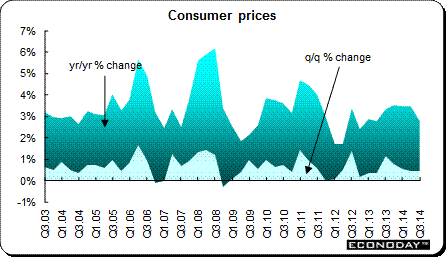
Inflation — Unlike most other industrial nations, Australia releases its consumer price index and producer price indexes only once a quarter rather than every month. Third quarter 2014 CPI was up 0.5 percent on the quarter and was up 2.3 percent when compared with the same quarter a year ago. However, the preferred RBA inflation measures — the trimmed mean was up 0.4 percent and 2.5 percent on the year while the weighted mean increased 0.6 percent and 2.6 percent. The RBA has an inflation target range of 2 percent to 3 percent.
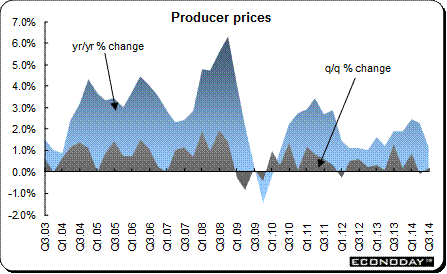
Second quarter producer prices were up 0.2 percent on the quarter and were up 1.2 percent when compared to the same quarter a year ago.
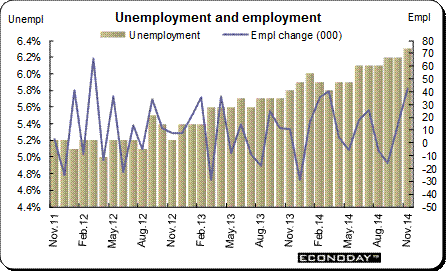
Unemployment — A major problem for the Australian economy was not underemployment but rather a labor shortage that threatened to drive up wages and inflation. After reaching a low of 4.1 percent in August 2008, the unemployment rate climbed to 5.8 percent in June 2009 and remained at or near that level for several months. The unemployment rate declined to 4.9 percent in mid-2011. Since then, the unemployment rate has climbed again. The unemployment rate currently is 6.3 percent.
Employment growth has slowed along with the resource boom. In 2010, employment for the year was up 300,000 jobs while in 2011, employment was up 49,700 jobs. In 2012, employment rebounded to a gain of 168,800. In 2013, only 64,100 jobs were created. Employment has been volatile in 2014. The economy added 168,700 jobs in the eleven months through November. The data have been subjected to major revisions due to a malfunctioning seasonal adjustment program, according to the Australia Bureau of Statistics.
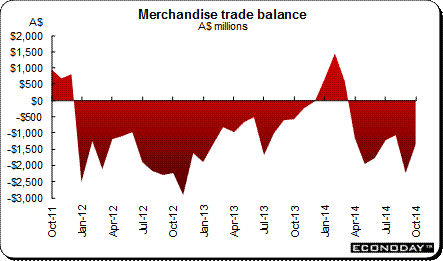
Merchandise trade — Trade was in surplus for 11 of 12 months in 2011. However, it recorded a deficit in every month in 2012. Both exports and imports declined six of 12 months in 2012. Exports were hit by weakening growth especially in China which is Australia's major export market. The strong Australian dollar also contributed to the pain.
Australia continued to record trade deficits in every month through November in 2013. From December through March the trade balance was in surplus. However, it returned to a deficit in April and has remained there through October.
|
|||||||
| Legal Notices | ©Copyright 1998-2025 Econoday, Inc. |
powered by
![[Econoday]](images/logo.gif)
![[Apple App Store]](/images/AppleAppStore.png) ![[Econoday on Kindle]](/images/kindle.jpg) 
|
||||||
