|
The week’s data from the US were less than inspiring, whether durable orders or export orders or personal spending. At least the PCE price indexes eased. A run down of global inflation reports shows similar cooling across economies, well most economies anyway as we’ll see that Australia is an exception. But first let’s look at two major European economies and what the latest inflation updates mean for Tuesday’s HICP report, one that could well determine the outcome of the coming ECB meeting.
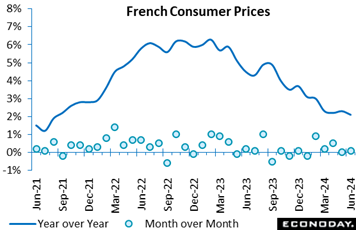 France’s national CPI flash for June slowed to 2.1 percent from 2.3 percent in May, a modest decline that can be attributed to year-over-year deceleration in food and energy prices. Prices of services, manufactured goods, and tobacco maintained May's growth rate. Month-over-month, consumer prices held nearly unchanged in June, with a slight rise of 0.1 percent following a flat 0.0 percent in May. This stability reflects minor increases in the prices of services and manufactured products, while energy prices, particularly for petroleum products, and food prices declined. Tobacco prices should remain steady throughout the month. France’s national CPI flash for June slowed to 2.1 percent from 2.3 percent in May, a modest decline that can be attributed to year-over-year deceleration in food and energy prices. Prices of services, manufactured goods, and tobacco maintained May's growth rate. Month-over-month, consumer prices held nearly unchanged in June, with a slight rise of 0.1 percent following a flat 0.0 percent in May. This stability reflects minor increases in the prices of services and manufactured products, while energy prices, particularly for petroleum products, and food prices declined. Tobacco prices should remain steady throughout the month.
The harmonised index of consumer prices rose 2.5 percent in June compared to 2.6 percent in May. On a month-over-month basis, the index edged up by 0.1 percent, mirroring the previous month's rise.
Producer prices continue to fall in France. In separately released data for May, industrial producer prices dropped by 1.2 percent from the previous month and by 5.1 percent compared to the same month last year. This marks the sixth consecutive month of decline, with prices falling by 1.4 percent for the domestic market and by 0.4 percent for foreign markets. In April, these decreases were even steeper at 2.8 percent overall, 3.6 percent domestically, and 0.3 percent for exports.
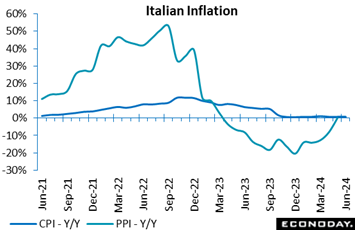 Italy’s national CPI flash saw a marginal rise of 0.1 percent month-over-month. Compared to June last year, the index showed growth of 0.8 percent, matching May’s year-over-year rate. The steady annual growth of the index masks divergent trends: prices for unprocessed foods dropped from 2.2 percent to 0.4 percent, services related to recreation, including repair and personal care, saw a slight decrease from 4.3 percent to 4.0 percent. Durable goods prices fell further from minus 0.7 percent to minus 1.1 percent. Conversely, non-regulated energy products prices rose from minus 13.5 percent to minus 10.3 percent. Regulated energy products saw an uptick from 0.7 percent to 3.6 percent, and processed food (including alcohol and tobacco) climbed from 1.8 percent to 2.2 percent. Italy’s national CPI flash saw a marginal rise of 0.1 percent month-over-month. Compared to June last year, the index showed growth of 0.8 percent, matching May’s year-over-year rate. The steady annual growth of the index masks divergent trends: prices for unprocessed foods dropped from 2.2 percent to 0.4 percent, services related to recreation, including repair and personal care, saw a slight decrease from 4.3 percent to 4.0 percent. Durable goods prices fell further from minus 0.7 percent to minus 1.1 percent. Conversely, non-regulated energy products prices rose from minus 13.5 percent to minus 10.3 percent. Regulated energy products saw an uptick from 0.7 percent to 3.6 percent, and processed food (including alcohol and tobacco) climbed from 1.8 percent to 2.2 percent.
The rate of change for Italy’s harmonised index of consumer prices rose 0.2 percent on a month-over-month basis and 0.9 percent annually, up from 0.8 percent in May.
Turning to producer prices, they rose 0.3 percent on the month in May but declined 3.5 percent in comparison to May of the previous year, with a more significant decline of 4.9 percent in the domestic market and a more modest decline of 0.8 percent abroad.
Recent inflation trends in Italy over the past three months indicate a moderate inflationary environment, suggesting stable economic conditions relative to other Euro area countries experiencing higher inflation rates.
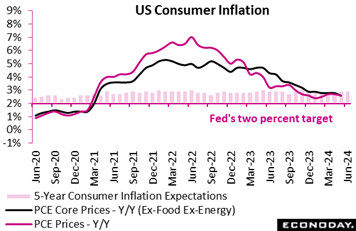 Though pressures aren’t as benign as they are in Italy, inflation in the US is definitely moderating including the most important indicators of all – the PCE price indexes which the Federal Reserve tracks closely. The PCE price index held unchanged on the month in May after climbing 0.3 percent in April, while the ex-food ex-energy core edged only 0.1 percent higher after April’s 0.3 percent gain. Both measures cooled to 2.6 percent on the year, the former from 2.7 percent and the core from 2.8 percent. Though pressures aren’t as benign as they are in Italy, inflation in the US is definitely moderating including the most important indicators of all – the PCE price indexes which the Federal Reserve tracks closely. The PCE price index held unchanged on the month in May after climbing 0.3 percent in April, while the ex-food ex-energy core edged only 0.1 percent higher after April’s 0.3 percent gain. Both measures cooled to 2.6 percent on the year, the former from 2.7 percent and the core from 2.8 percent.
These results will give rise to hopes that Fed officials will reconsider the hawkishness of their outlook for a cut in interest rates. Central to this hope is core’s year-over-year rate which is the lowest since March 2021. Policymakers have been focusing on core inflation as commodities like food and energy have seen rapid price declines while items like housing and services have seen more persistent pressures.
The PCE indexes are released as part of personal income and outlays, a report that offers another incentive to cut rates: significant slowing in consumer spending. Personal consumption expenditures rose only 0.2 percent in May after rising only 0.1 percent in April. Consumption was modest overall with increases of 0.3 percent for durables, 0.2 percent for nondurables, and 0.3 in services. In a separate report on the factory sector, core capital goods orders fell sharply in May in what is a negative indication for business investment (see Production section below for details).
Fed Chair Jerome Powell will have to incorporate the latest data into his semiannual monetary policy testimony when it is delivered after the long Independence Day weekend (July 4-7). He will probably be asked about it at his appearance in a policy panel at an ECB forum on July 2. He will have to thread the needle between one month's positive developments and caution about the bigger picture.
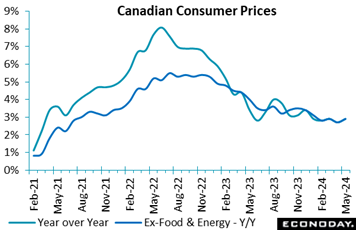 Consumer prices in Canada rose to a 12-month increase of 2.9 percent in May, up from 2.7 percent in April and compared with Econoday’s consensus for 2.6 percent. The ex-food ex-energy core also rose from 2.7 to 2.9 percent. The central bank projects inflation to average 2.9 percent in the second quarter, and though May’s report puts inflation on track to meet this projection, it will prove disappointing given expectations for cooling. The upside miss undercuts expectations for a rate cut at the Bank of Canada’s July 24 meeting. Consumer prices in Canada rose to a 12-month increase of 2.9 percent in May, up from 2.7 percent in April and compared with Econoday’s consensus for 2.6 percent. The ex-food ex-energy core also rose from 2.7 to 2.9 percent. The central bank projects inflation to average 2.9 percent in the second quarter, and though May’s report puts inflation on track to meet this projection, it will prove disappointing given expectations for cooling. The upside miss undercuts expectations for a rate cut at the Bank of Canada’s July 24 meeting.
Statistics Canada blamed May’s acceleration on services, up 4.6 percent in May following a similar 4.2 percent bump in April. The culprits included cellular phone services, travel tour prices, rent, and air transport. Goods prices were up 1.0 percent from a year ago, the same as in April while grocery prices were up 1.5 percent in May versus an increase of 1.4 percent in April.
On a monthly unadjusted basis, the big riser was travel tour fees, up 10.4 percent in May from April, and traveler accommodation, up 16.0 percent. Grocery prices rose 1.1 percent, the largest one-month rise since January 2023.
Looking at main contributors to the 12-month increase, mortgage interest costs rose 23.3 percent reflecting higher interest rates. Rent is up 8.9 percent, restaurant food is up 5.6 percent, and car insurance premiums are up 7.0 percent. The main downward contributors on year were telephone services down 14.6 percent, internet access services down 9.7 percent, computers down 9.9 percent, and men's clothing down 5.1 percent.
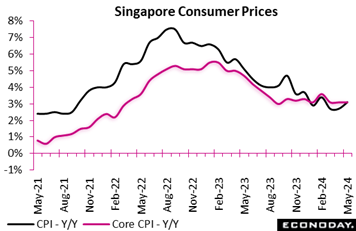 Singapore's headline consumer price index rose 3.1 percent on the year in May, up from 2.7 percent in April. The Monetary Authority of Singapore's preferred measure of core inflation, which excludes the cost of accommodation and private road transport, was unchanged at 3.1 percent in May. Singapore's headline consumer price index rose 3.1 percent on the year in May, up from 2.7 percent in April. The Monetary Authority of Singapore's preferred measure of core inflation, which excludes the cost of accommodation and private road transport, was unchanged at 3.1 percent in May.
The increase in headline inflation in May was mainly driven by a year-over-year increase in private transport prices accelerating sharply from 0.3 percent to 2.8 percent. Steady core inflation in May, in contrast, reflects stability in other major categories. Food prices rose 2.8 percent on the year, as they did previously, services prices picked up slightly from 3.5 percent to 3.6 percent, and prices for retail and other goods rose 1.5 percent on the year after a previous increase of 1.6 percent.
Officials at the MAS retained their target for appreciation of Singapore's exchange rate at their last quarterly meeting in April, and officials this week once again expressed confidence that this appreciation will curb imported inflation over the rest of the year. An easing in labour market tightness is also expected to reduce pressure on domestic prices. The next quarterly policy meeting for the MAS is scheduled to take place mid-July.
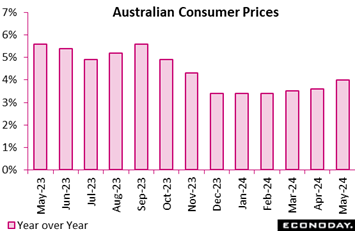 Monthly CPI data show that energy prices pushed up headline inflation in Australia more sharply than anticipated in May to 4.0 percent from 3.6 percent in April, above the consensus forecast of 3.8 percent. This is the third consecutive increase in headline inflation and takes the level further above the Reserve Bank of Australia's target range of two percent to three percent. Monthly CPI data show that energy prices pushed up headline inflation in Australia more sharply than anticipated in May to 4.0 percent from 3.6 percent in April, above the consensus forecast of 3.8 percent. This is the third consecutive increase in headline inflation and takes the level further above the Reserve Bank of Australia's target range of two percent to three percent.
Higher headline inflation in May was largely driven by energy costs, with the year-over-year increase in automotive fuel prices accelerating from 7.4 percent to 9.3 percent and electricity prices increasing 6.5 percent on the year after a previous increase of 4.2 percent. Excluding the impact of government rebates, electricity prices would have risen 14.5 percent on the year, up from a previous increase of 13.9 percent. Clothing prices and holiday and travel accommodation charges also rose at a faster pace, partly offset by smaller price increases for food and communication.
May’s data show mixed moves in underlying price pressures. The measure of inflation that excludes volatile items – including fuel and holiday travel – eased from 4.1 percent in April to 4.0 percent in May but the monthly trimmed mean measure rose from 4.1 percent to 4.4 percent.
At the RBA's previous meeting, held last week, officials highlighted uncertainties impacting the inflation outlook and again reiterated that returning inflation to target remains their highest priority. Officials also noted that "recent data have demonstrated that the process of returning inflation to target is unlikely to be smooth". May's data showing another increase in inflation is likely to reinforce the RBA's reluctance to ease policy and could force officials to consider more seriously an additional rate increase.
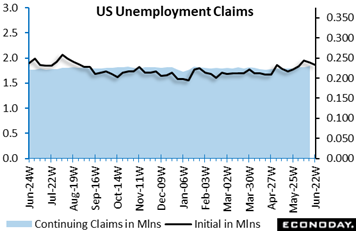 Initial US jobless claims fell 6,000 to 233,000 in the week ended June 22 after 239,000 in the prior week. The reading was close to the consensus of 236,000 in Econoday’s survey of forecasters. The four-week moving average rose 3,000 to 236,000. After a little escalation in filings for benefits in mid-May and early June, the underlying pace seems to have leveled off somewhere in the 230,000-240,000 range. While this is an uptick, the level remains modest in the historical context and consistent with a healthy labor market in a tempered expansion. Initial US jobless claims fell 6,000 to 233,000 in the week ended June 22 after 239,000 in the prior week. The reading was close to the consensus of 236,000 in Econoday’s survey of forecasters. The four-week moving average rose 3,000 to 236,000. After a little escalation in filings for benefits in mid-May and early June, the underlying pace seems to have leveled off somewhere in the 230,000-240,000 range. While this is an uptick, the level remains modest in the historical context and consistent with a healthy labor market in a tempered expansion.
The number of insured unemployment beneficiaries rose 18,000 to 1.839 million in the June 15 week from 1.821 million in the prior week. The change is well within normal week-to-week variation. The level was over the 1.8-million mark for a third week in a row, pointing to a slight increase in the number of unemployed among those eligible for benefits. The insured rate of unemployment edged to 1.2 percent in the June 15 week, up a tick from the revised 1.1 percent in the prior week. The reading for the June 8 week is the only time the rate has been other than 1.2 percent since March 2023. The jobs market has remained consistently tight, at least for those who can apply for benefits.
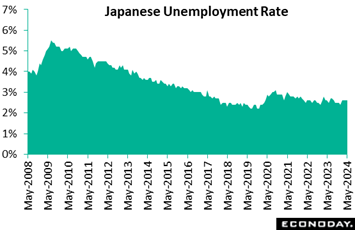 Japanese payrolls posted the 22nd straight rise on year in May amid labor shortages at retailers, hotels, restaurants and education support firms while the unemployment rate was unchanged at 2.6 percent for the third month in a row. Japanese payrolls posted the 22nd straight rise on year in May amid labor shortages at retailers, hotels, restaurants and education support firms while the unemployment rate was unchanged at 2.6 percent for the third month in a row.
Compared to the previous month, the number of people who lost their jobs or retired was unchanged in May after falling 4.3 percent in April for the first fall in three months. The number of those who quit to look for better positions fell 3.8 percent after marking the first drop in three months in April with a 1.3 percent fall. The number of those who began looking for work and thus were counted as being unemployed rose 2.0 percent after rising at the same rate the previous month. Tight labor conditions and rising wages are encouraging people to join or return to the workforce.
From a year earlier, the number of employed rose 210,000 to an unadjusted 67.66 million in May for the 22nd straight increase, led by a sharp rise among women that more than offset a slight drop in men. Regular jobs rose on year for the seventh straight month while non-regular jobs dropped after recent sharp gains. It followed increases of 90,000 in April, 270,000 in March and 610,000 in February.
The number of unemployed rose 50,000 on the year to an unadjusted 1.93 million in May, after rising 30,000 in April, falling 80,000 in March and rising 30,000 in February. It has drifted down from a pandemic peak of 2.17 million in October 2020. December's 1.56 million was the lowest since 1.46 million in December 2019.
In its monthly economic report for June, the government maintained its overall assessment, saying the economy is recovering "moderately" and likely to stay on course pinning its hopes on more widespread wage hikes and stimulative effects of planned energy subsidies and cash handouts aimed at easing the pain of pensioners and low-income earners hard hit by elevated living costs. It also repeated that employment conditions are "showing signs of improvement."
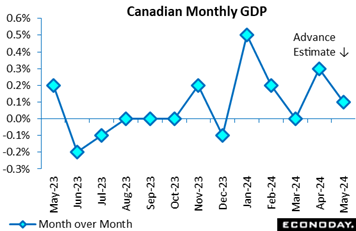 The Canadian economy was up 0.3 percent in April, in line with a gain of 0.3 percent expected in the Econoday survey and the Statistics Canada estimate. March was unrevised from the flat showing initially reported. Year over year, the economy expanded by 1.1 percent in April. The Canadian economy was up 0.3 percent in April, in line with a gain of 0.3 percent expected in the Econoday survey and the Statistics Canada estimate. March was unrevised from the flat showing initially reported. Year over year, the economy expanded by 1.1 percent in April.
The advance estimate for May points to a gain of 0.1 percent. The weaker projection for May suggests the economy quickly came off the boil after April's relatively strong start to the second quarter.
Services in April rose 0.3 percent while goods-producing industries were also up 0.3 percent in April from March. For March versus February, goods-producing industries declined by 0.1 percent in March and services were flat.
In April, 15 of 20 sectors increased on the month. Wholesale trade led the way with a gain of 2.0 percent after falling 1.2 percent in March. Mining, quarrying and gas extraction had a big month too, up 1.8 percent in April after declining 0.3 percent in March.
Manufacturing bounced back by 0.4 percent in April after falling 0.8 percent in March. Retail trade was up 0.5 percent in April after dipping 0.3 percent in March. The public sector saw a gain of 0.2 percent in April after the same 0.2 percent rise in March.
On the downside, construction declined 0.4 percent in April after rising 0.7 percent in March, which was its biggest rise since October 2022. Residential building was the culprit, down 2.3 percent on the month, its biggest decline since May 2023. Utilities declined 0.2 percent in April after rising 0.5 percent in March.
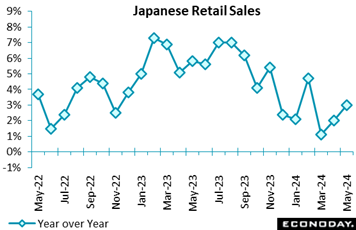 Japanese retail sales rose 3.0 percent on year in May, above the consensus call of a 2.0 percent rise, with the pace of increase accelerating from a downwardly revised 2.0 percent gain in April, thanks to continued solid department store sales and a smaller drop in vehicle sales. Japanese retail sales rose 3.0 percent on year in May, above the consensus call of a 2.0 percent rise, with the pace of increase accelerating from a downwardly revised 2.0 percent gain in April, thanks to continued solid department store sales and a smaller drop in vehicle sales.
Strong inbound spending and high demand for luxury brand goods continued to propel department store sales while higher temperatures propped up sales of seasonal goods. Resumed vehicle production in March after two months of suspension over a safety scandal led to a smaller decline in auto sales.
Retail sales have been above year-earlier levels for a 27th consecutive month, but the pace of increase has slowed from the peak of 7.3 percent in February 2023. High costs for daily necessities are hurting consumer sentiment and real wages have been falling for two years.
On the month, retail sales jumped a seasonally adjusted 1.7 percent on solid department store sales, a rebound in auto sales and higher fuel prices, after rebounding 0.8 percent in April and falling 1.2 percent in March. It was also stronger than the median forecast of a 0.7 percent increase.
The Ministry of Economy, Trade and Industry upgraded its assessment for the first time in 15 months, saying retail sales are "on a gradual uptrend." In the previous five months, it said sales were "taking one step forward and one step back”.
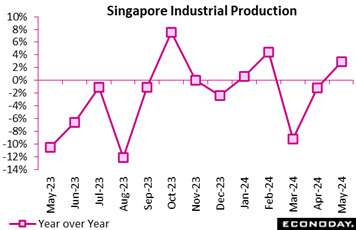 Singapore industrial production recorded slower growth in May, with output increasing 1.1 percent on the month after advancing 7.5 percent in April. In year-over-year terms, industrial production rose 2.9 percent in May after falling 1.2 percent in April. This rebound in year-over-year growth was largely driven by the electronics industry, which accounts for nearly half of the sector, with output there surging 20.1 percent on the year after falling 1.1 percent previously. In the biomedical industry, where conditions are often volatile, output fell 42.6 percent after a previous decline of 27.7 percent. Output growth picked up in other parts of the sector. Excluding the biomedical industry, output rose 10.1 percent on the year in May after advancing 1.9 percent in April. Singapore industrial production recorded slower growth in May, with output increasing 1.1 percent on the month after advancing 7.5 percent in April. In year-over-year terms, industrial production rose 2.9 percent in May after falling 1.2 percent in April. This rebound in year-over-year growth was largely driven by the electronics industry, which accounts for nearly half of the sector, with output there surging 20.1 percent on the year after falling 1.1 percent previously. In the biomedical industry, where conditions are often volatile, output fell 42.6 percent after a previous decline of 27.7 percent. Output growth picked up in other parts of the sector. Excluding the biomedical industry, output rose 10.1 percent on the year in May after advancing 1.9 percent in April.
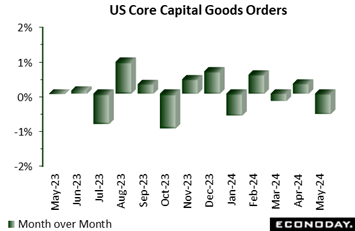 Orders for US capital goods are not looking strong in a major headline from the durable goods report that may well lead to downgrades for business investment. Core capital goods (nondefense ex-aircraft) fell a steep 0.6 percent on the month in May for the second decline in the last three months and far below Econoday's consensus for a 0.1 percent gain. Year-over-year, core orders are now in the negative column at minus 0.2 percent. Orders for US capital goods are not looking strong in a major headline from the durable goods report that may well lead to downgrades for business investment. Core capital goods (nondefense ex-aircraft) fell a steep 0.6 percent on the month in May for the second decline in the last three months and far below Econoday's consensus for a 0.1 percent gain. Year-over-year, core orders are now in the negative column at minus 0.2 percent.
Total durable orders edged 0.1 percent higher on the month versus Econoday's for no change while ex-transportation orders fell 0.1 percent which was below the consensus for a 0.1 percent gain. Total shipments fell 0.3 percent, though this follows April's 1.2 percent jump, while both unfilled orders and total inventories are modest positives in the report, up 0.2 and 0.3 percent respectively.
Details on new orders include monthly declines for machinery of 0.5 percent, for communications equipment of 1.6 percent, and electrical equipment of 0.4 percent. All these are inputs into core capital goods. Computers, another input, managed only a 0.1 percent gain.
Transportation details include a 0.7 percent rise for motor vehicles to extend this category's run of gains and a comparatively subdued 2.8 percent decline for commercial aircraft where monthly data are often highly volatile. Defense aircraft are a positive in the report, jumping 22.6 percent on the month.
Total new orders are up on the year, but not by much at only a nominal 0.8 percent which is below the rate of inflation. There have been signs of life coming from the manufacturing sector but they don't include this report which may have forecasters calling for another sub-50 score for the ISM manufacturing report on July 1.
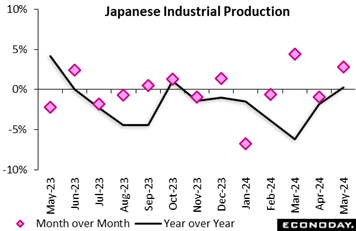 Japan's industrial production rebounded a seasonally adjusted 2.8 percent on the month in May after falling a downwardly revised 0.9 percent in April, thanks to emerging positive effects of vehicle output that resumed in March after being suspended for about two months over safety issues. Japan's industrial production rebounded a seasonally adjusted 2.8 percent on the month in May after falling a downwardly revised 0.9 percent in April, thanks to emerging positive effects of vehicle output that resumed in March after being suspended for about two months over safety issues.
May’s gain was stronger than the median forecast of a 2.0 percent rise and topped the forecasts that ranged from 0.6 percent to 2.5 percent gains. The increase was also led by electric machinery including lighting fixtures and navigation systems for vehicles as well as by general machinery such as conveyors and turbines.
From a year earlier, factory output posted the first increase in seven months, up 0.3 percent, following a downwardly revised 1.8 percent slump in the prior month. It was firmer than the consensus forecast of a 0.1 percent dip.
The METI's survey of producers indicated that output is expected to slip back 6.0 percent in June, led by lower output of production machinery and vehicles, before rising 3.6 percent in July on a rebound in production machinery and a rise in chemicals.
The ministry maintained its assessment saying industrial output "has weakened while taking one step forward and one step back." The METI repeated that it will keep a close watch on the effects of global economic growth and resumed automobile production.
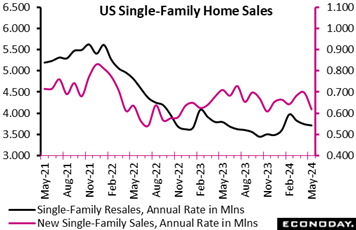 Sales of new single-family homes fell a steep 11.3 percent in May to 619,000 at a seasonally adjusted annual rate after 698,000 in April, and were down 16.5 percent from 741,000 in the year-ago month. The consensus for May in the Econoday survey of forecasters looked for sales of 650,000. May’s weakness in single-family homes in May no doubt tied to elevated mortgage rates. The Freddie Mac average rate for a 30-year fixed rate mortgage hovered near 7 percent in April and May. This in turn affected the affordability of homes for some buyers. Sales of new single-family homes fell a steep 11.3 percent in May to 619,000 at a seasonally adjusted annual rate after 698,000 in April, and were down 16.5 percent from 741,000 in the year-ago month. The consensus for May in the Econoday survey of forecasters looked for sales of 650,000. May’s weakness in single-family homes in May no doubt tied to elevated mortgage rates. The Freddie Mac average rate for a 30-year fixed rate mortgage hovered near 7 percent in April and May. This in turn affected the affordability of homes for some buyers.
In May, the median price of a new single-family home was basically unchanged at $417,400, down a scant 0.1 percent from $417,000 in the prior month. The supply of homes available for sale rose to 9.3 months in May, up from 8.1 in April and 6.9 in May 2023. This is the highest since 9.7 months in December 2022. Homebuilders are likely to respond by cutting back on new construction projects until current inventories fall.
Ongoing high prices combined with a near-term peak in mortgage rates come at a time when more resales are coming on the market. As a result, fewer homebuyers are taking out contracts new homes not yet started which accounted for 12 percent of the total sold in May, the smallest share since 13 percent in December 2022. For homes under construction, the share is up to 41 percent in May after 37 percent in April. This suggests that home shoppers who can't find an existing unit are more willing to buy new construction but are in less of a hurry than in the period when rates were lower. Sales of completed homes account for 47 percent of the total.
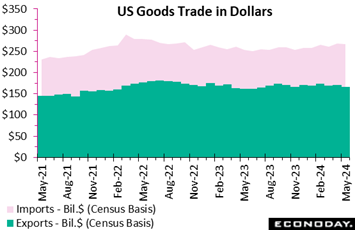 A sharp drop in exports made for the steepest US goods deficit since May 2022, which is bad news for second-quarter US GDP. May 2024's deficit of $100.6 billion was much deeper than Econoday's consensus for $95.6 billion. May's goods deficit was $2.6 billion deeper than April's deficit which already was a very steep $5.8 billion deeper than March's deficit. A sharp drop in exports made for the steepest US goods deficit since May 2022, which is bad news for second-quarter US GDP. May 2024's deficit of $100.6 billion was much deeper than Econoday's consensus for $95.6 billion. May's goods deficit was $2.6 billion deeper than April's deficit which already was a very steep $5.8 billion deeper than March's deficit.
Exports dropped $2.0 billion on the month in May to a subdued $166.7 billion for the lowest total since July last year. Declines were posted nearly across all categories especially for industrial supplies and including foods, feeds & beverages and also capital goods, the latter a usual strength for the US.
The trade imbalance would have been even greater if not for a 0.7 percent decline for imports to $257.3 billion where an increase for industrial supplies was outmatched by declines for consumer goods, capital goods, and also vehicles, the latter however following sharp gains in prior months.
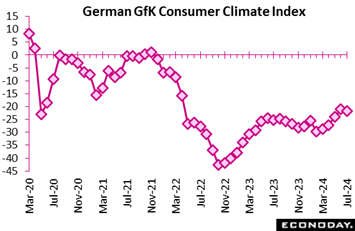 Germany's GfK consumer climate survey for July showed slightly weaker consumer sentiment with the index falling to minus 21.8 from minus 21.0 in June. This is the first fall in the index in five months, with respondents noting the impact of higher inflation on real income growth. Germany's GfK consumer climate survey for July showed slightly weaker consumer sentiment with the index falling to minus 21.8 from minus 21.0 in June. This is the first fall in the index in five months, with respondents noting the impact of higher inflation on real income growth.
The survey's measure of income expectations fell from plus 12.5 to plus 8.2, while its measure of economic expectations dropped more sharply from plus 9.8 to plus 2.5. Respondents reported that their willingness to spend remains low and their willingness to save remains high, citing the impact of high food and energy prices on their ability to make large discretionary purchases.
Econoday’s Relative Performance Index (RPI) ended the week at minus 8 to indicate that global economic data, on net, are coming in just on the low side of consensus estimates. This extends a month-long trend and is little changed from the prior week’s minus 9.
Eurozone economic data are significantly underperforming, at minus 41 on the RPI for a second week in a row which if extended over the coming two weeks could build expectations for a back-to-back rate cut at the ECB’s July 18 meeting. June’s harmonised inflation flash on Tuesday, July 2 will be critical for rate expectations.
Germany is at minus 36 and were it not for inflation data that are meeting consensus estimates, the country’s underperformance would be more pronounced, at minus 52 for the Relative Performance Index less Prices (RPI-P). This indicates substantial weakness for the country’s real economy.
The UK is also underperforming, at minus 25 on the RPI and minus 21 on the RPI-P. The Bank of England next meets on August 1 in the wake of the July 4 election.
Stronger-than-expected inflation data have lifted Canada to plus 37 which scales down to a still solid 26 excluding May’s CPI report. The Bank of Canada, which cut rates in early June, next meets in late July and if the country continues to outperform, another rate cut would not be the expectation.
Retail sales and industrial production both gave Japan a lift, moving from the prior week’s minus 11 to plus 15, while the US ended the week right at the global score of plus 8 for the RPI and plus 8 for the RPI-P. Scores at plus or minus 10 indicate that recent data, on net, are coming within Econoday’s consensus ranges, a fact that won’t add heat to talk of a Federal Reserve rate cut following May’s favorable PCE price results.
**Contributing to this article were Jeremy Hawkins, Brian Jackson, Mace News, Max Sato, Olajide Oyadeyi, and Theresa Sheehan
German consumer price data on Monday, which are expected to ease, will firm up consensus estimates for Tuesday’s harmonised inflation report from the Eurozone, where incremental cooling is currently expected, to a 2.5 percent rate overall and 2.8 percent for the narrow core. These results in turn will set up expectations for the July 18 meeting of the European Central Bank which last month cut rates for the first time this cycle.
The week will kick off with China’s official CFLP PMI report which will be posted on Sunday local time and is expected to prove flat once again. Japan’s Tankan will follow on Monday amid expectations for steady conditions with non-manufacturers remaining significantly more optimistic than manufacturers.
German factory data will include manufacturing orders on Thursday and industrial production on Friday; both are expected to rebound. Canada and the US will both post their monthly employment reports on Friday. Forecasters are looking for solid but slowing gains for both, including a 189,000 rise for US nonfarm payrolls.
China: CFLP PMIs for June (Sun 0930 CST; Sun 0130 GMT; Sat 2130 EDT)
Manufacturing PMI, Consensus Forecast: 49.6
Non-manufacturing PMI, Consensus Forecast: 51.1
The CFLP manufacturing PMI is expected to hold steady at 49.6 in June from May’s 49.5. The non-manufacturing PMI, expected to hold unchanged at 51.1, has held above 50 for more than a year.
Japanese Tankan for Second Quarter (Mon 0850 JST; Sun 2350 GMT; Sun 1950 EDT)
Consensus Forecast, Large Manufacturers: 12
Consensus Forecast, Large Non-Manufacturers: 33
Forecasters see the second-quarter index for large manufacturers edging to 12 from 11 in the first quarter and from 34 to 33 for non-manufacturers.
Australian Retail Sales for May (Mon 1130 AEST; Mon 0130 GMT; Sun 2130 EDT)
Consensus Forecast, Month over Month: 0.3%
Retail sales in May are expected to increase 0.3 percent on the month after April’s weaker-than-
expected 0.1 percent increase.
China: S&P Manufacturing PMI for June (Mon 0945 CST; Mon 0145 GMT; Sun 2145 EDT)
Consensus Forecast: 51.5
After 51.7 in May, S&P's manufacturing PMI in June is expected to hold in plus-50 ground for an eighth straight month.
Indian PMI Manufacturing for June (Mon 1030 IST; Mon 0500 GMT; Mon 0100 EDT)
Consensus Forecast, Year over Year: 58.5
June’s manufacturing PMI is expected to re-accelerate to 58.5 versus May’s 57.5 which compared with expectations for 58.4.
German CPI, Preliminary June (Mon 1400 CEST; Mon 1200 GMT; Mon 0800 EDT)
Consensus Forecast, Month over Month: 0.2%
Consensus Forecast, Year over Year: 2.3%
HICP, Preliminary June
Consensus Forecast, Month over Month: 0.2%
Consensus Forecast, Year over Year: 2.6%
June’s consensus is a year-over-year 2.3 percent versus 2.4 percent in May and 2.2 percent in April. The consensus for the HICP is 2.6 percent versus 2.8 percent in May and 2.4 percent in April.
US: ISM Manufacturing Index for June (Mon 1000 EDT; Mon 1400 GMT)
Consensus Forecast: 49.1
After falling a half point in May to a lower-than-expected 48.7, the ISM manufacturing index is expected to rebound 4 tenths to a still sub-50 level of 49.1.
Korean CPI for June (Tue 0800 KST; Mon 2300 GMT; Mon 1900 EDT)
Consensus Forecast, Month over Month: 0.1%
Consensus Forecast, Year over Year: 2.7%
Consumer prices in June, which in May cooled from 2.9 to 2.7 percent, are expected to hold steady at 2.7 percent.
Eurozone HICP Flash for June (Tue 1100 CEST; Tue 0900 GMT; Tue 0500 EDT)
Consensus Forecast, Year over Year: 2.5%
Narrow Core
Consensus Forecast, Year over Year: 2.8%
Consensus for June’s HICP flash is 2.5 percent and 2.8 percent for the narrow core. These would compare respectively with May’s 2.6 and 2.9 percent.
Eurozone Unemployment Rate for May (Tue 1100 CEST; Tue 0900 GMT; Tue 0500 EDT)
Consensus Forecast: 6.5%
Consensus for May's unemployment rate is a 1 tenth rise to 6.5 percent from a record low of 6.4 percent. The Eurozone labour market has been very tight.
China: S&P PMI Composite for June (Wed 0945 CST; Wed 0145 GMT; Tue 2145 EDT)
Services Index, Consensus Forecast: 53.4
S&P's services PMI is expected to slow to 53.4 in June versus May’s stronger-than-expected 54.0.
Eurozone PPI for May (Wed 1100 CEST; Wed 1000 GMT; Wed 0500 EDT)
Consensus Forecast, Year over Year: -4.3%
Producer price contraction is expected to ease to 4.3 percent in May which would compare with 5.7 percent contraction in April.
US ADP Private Payrolls for June (Wed 0815 EDT; Wed 1215 GMT)
Consensus Forecast: 163,000
Forecasters see ADP's June employment number at 163,000. This would compare with May growth in private payrolls reported by the Bureau of Labor Statistics of 229,000. ADP’s number for May was 152,000.
Canada Merchandise Trade Balance for May (Wed 0830 EDT; Wed 1230 GMT)
Consensus Forecast: -C$1.6 billion
May’s trade balance is seen in deficit at C$1.6 billion versus April’s deficit of C$1.047 billion and March’s deficit of C$1.985 billion.
Australian International Trade in Goods for May (Thu 1130 AEST; Thu 0130 GMT; Wed 2130 EDT)
Consensus Forecast, Balance: A$6.7 billion
Consensus for international trade in goods in May is a surplus of A$6.7 billion versus April’s A$6.548 billion surplus that benefited, not from strength in exports, but a sharp drop in imports.
German Manufacturing Orders for May (Thu 0800 CEST; Thu 0600 GMT; Thu 0200 EDT)
Consensus Forecast, Month over Month: 1.0%
Manufacturing orders are expected to increase a monthly 1.0 percent in May versus April’s 0.2 percent decline, which was the fourth month in a row to miss the consensus estimate.
Japanese Household Spending for May (Fri 0830 JST; Thu 2330 GMT; Thu 1930 EDT)
Consensus Forecast , Month over Month: 0.7%
Consensus Forecast , Year over Year: 0.2%
Real household spending in May is expected to rise 0.2 percent on the year versus an as-expected 0.5 percent rise in April which was the first increase in more than a year.
German Industrial Production for May (Fri 0800 CEST; Fri 0600 GMT; Fri 0200 EDT)
Consensus Forecast, Month over Month: 0.3%
Industrial production in May is expected to rise 0.3 percent on the month after edging 0.1 percent lower in April and falling 0.4 percent in March.
French Industrial Production for May (Fri 0845 CEST; Fri 0645 GMT; Fri 0245 EDT)
Consensus Forecast, Month over Month: -0.3%
May’s consensus is a 0.3 percent decline following April’s 0.5 percent gain.
Eurozone Retail Sales for May (Fri 1100 CEST; Fri 0900 GMT; Fri 0500 EDT)
Consensus Forecast, Month over Month: 0.1%
Consensus Forecast, Year over Year: -0.4%
Retail sales volumes in May are expected to inch 0.1 percent higher on the month after April’s weak 0.5 percent fall.
Canadian Labour Force Survey for June (Fri 0830 EDT; Fri 1230 GMT)
Consensus Forecast: Employment Change: 21,300
Consensus Forecast: Unemployment Rate: 6.3%
Employment in June is expected to rise 21,300 versus May’s higher-than-expected 27,000 that followed April’s much higher-than-expected 90,400 jump. The unemployment rate is expected to rise a tenth to 6.3 percent in June as it did in May.
US Employment Situation for June (Fri 0830 EDT; Fri 1230 GMT)
Consensus Forecast: Change in Nonfarm Payrolls: 189,000
Consensus Forecast: Unemployment Rate: 4.0%
Consensus Forecast: Average Hourly Earnings M/M: 0.3%
Consensus Forecast: Average Hourly Earnings Y/Y: 3.9%
A 189,000 rise is the call for nonfarm payroll growth in June versus a much higher-than-expected 272,000 rise in May. Average hourly earnings in June are expected to rise 0.3 percent on the month for a year-over-year rate of 3.9 percent; these would compare with May’s rates of 0.4 percent on the month and 4.1 percent on the year, both of which were also higher than expected. June’s unemployment rate is expected to hold unchanged at May’s 4.0 percent.
|

![[Apple App Store]](/images/AppleAppStore.png)
![[Econoday on Kindle]](/images/kindle.jpg)