|
Long Term Perspective The 1980s saw a negative spread of 23 basis points between the federal funds rate and the yield on the 1-year Treasury bill. This shifted sharply in the 1990s when the average spread was a positive 19 basis points.
The average spread between the year bill and the federal funds rate stood at a mere 5 basis points over the 2000 through 2014 period. This was due to the Fed's rate policy of remaining extraordinarily low for an extended period.
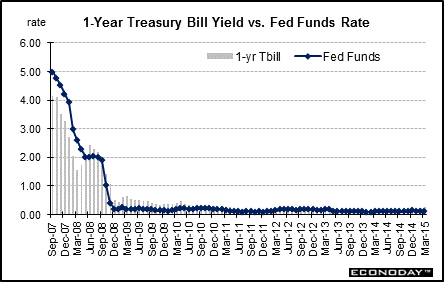
Short Term Perspective Since mid-2006 markets had been building in expectations of pending rate cuts by the Fed and rates on the 1-year bill edged down during the second half of 2006 even the fed funds rate had held steady. Rates were generally steady in 2007 until the credit crunch rattled equity and credit markets. Rates fell sharply from August 2007 and into late 2008 with flight to quality a factor along with the Fed's easing.
In mid-2008, a spike in oil prices led to a temporary jump in inflation fears and in the 1-year T-bill rate. More recently in 2009 and 2010, a sluggish recovery, flight to safety over concerns about European sovereign debt, bank problems in Cyprus, and the Fed maintaining the stance that the fed funds rate will be low for through late 2015 (based on FOMC forecasts and FedSpeak) have led rates to remain extremely low. Concerns about European debt problems have been on and off into early 2013. Most recently, worries over Ukraine and possible Russian intervention have led to some flight to safety. Worries over Gaza also have weighed on rates recently. Most recently, markets have worried about Greece's ability and willingness to continue austerity plans. Also, growth in Europe and Asia is softer. In March, the one year bill firmed 3 basis points to 0.25 percent.
Values shown reflect monthly averages.
|
|||||||
| Legal Notices | ©Copyright 1998-2024 Econoday, Inc. |
powered by
![[Apple App Store]](/images/AppleAppStore.png) ![[Econoday on Kindle]](/images/kindle.jpg) 
|
||||||