|
Long Term Perspective Over the first decade of the new millennium, the Treasury Department had sharp swings in its financing needs and has made major changes in the issuance of the 30-year Treasury note. The first major change was when the Treasury stopped issuing 30-year bonds in 2002. As the average maturity of outstanding bonds decreased, the Treasury began to calculate the average yield on long-term bonds with remaining maturities of greater than 25 year, called the Long-Term Average Rate. On June 1, 2004, the Treasury stopped calculating this Long-Term Average Rate and shifted to 20-year bond yields because the average maturity of bonds continued to drop (since we didn't have new 30-year bonds). On February 9, 2006, Treasury reintroduced the 30-year constant maturity.
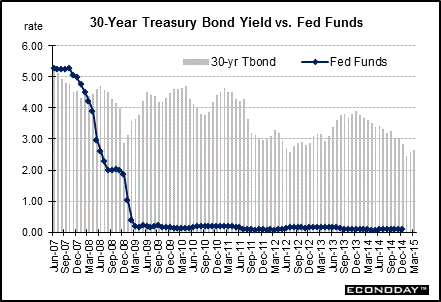
The average spread between the 30-year Treasury bond yield and the federal funds rate was 184 basis points in the 1990s, a far cry from the modest 59 basis point spread averaged in the 1980s. The 1980s was an unusual period with high interest rates (especially short-term rates) and two back-to-back recessions. What happened as the market realized that the 30-year bond would be discontinued? The year 2000 brought unusual behavior to the 30-year bond. Since the Treasury announced that it would reduce the quantity of 30-year bonds offered in the market, a premium developed for these long term issues causing their prices to rise and their yields to fall (below the federal funds rate). The Treasury went even further in October 2001 when they announced the indefinite suspension of new 30-year bonds. But the Treasury Department found the need to bring the long bond back. In August 2005, the Treasury announced the resurrection of the 30-year bond – and the first issue was auctioned in February 2006.
Late in 2008, increased recession fears, extreme concern about financial markets, and sharply lower oil prices led rates down sharply. After credit markets began to calm somewhat in early 2009, fears of ballooning federal deficits and some reversal of flight to safety led rates to rise. Supply worries and an improving recovery bumped rates up a bit in early 2010.
How has the spread between the long bond and the fed funds rate evolved? The spread averaged 135 basis points in 2005, but fell sharply in 2006 to minus 9 basis points and then to minus 19 basis points in 2007. But the spread jumped back into positive territory in 2008, averaging 235 basis points. In 2009, this spread stood at 391 basis points, at 408 basis points in 2010, and at 381 in 2011. From 2000 through 2014, the spread between the long bond yield and the federal funds rate averaged 249 basis points.
Short Term Perspective Flight to safety over European sovereign debt bumped yields down during much of late 2010. Briefly in early 2011, a strengthening in recovery, inflation fears, and reversal of flight to safety led rates up. But in mid-2011, disappointing economic news and worries about contagion from possible default on European sovereign debut bumped rates back down. Flight to safety was been quite strong going back to 2011over concern about possible default on Greek sovereign debt and over a sharp drop in equities at mid-year though equities did make a comeback toward year end in 2011. Worries about Greece continued into 2015.
Flight to safety was off and on in 2012 but more on than not. Also, the Fed's "Operation Twist" bumped long-term rates down somewhat. Later, QE3 also weighed on long rates after the September 13, 2012 FOMC announcement as did QE4 in December 2012 (some lump this second program into QE3). However, comments by Fed officials of the "possibility" of tapering asset purchases bumped yields up in June 2013. Expectations of Fed taper bumped rates up in late 2013. Actual Fed taper through October 2014 kept upward pressure on rates but was more than offset by flight to safety over foreign events late in the year and into 2015. The long bond average yield rose 6 basis points in March to 2.63 percent.
Values shown reflect monthly averages.
|
|||||||
| Legal Notices | ©Copyright 1998-2024 Econoday, Inc. |
powered by
![[Apple App Store]](/images/AppleAppStore.png) ![[Econoday on Kindle]](/images/kindle.jpg) 
|
||||||