|
Long Term Perspective In the 1980s, the spread between the 7-year note yield and the federal funds rate averaged minus 183 basis points. The 1980s was generally a period of high interest rates and relatively high inflation - at least in the first half of the decade. The spread turned around in the 1990s and averaged 138 basis points (where 7-year note yields were higher than the funds rate). The spread between the 7-year note yield and the federal funds rate averaged 146 basis points between 2000 and 2014.
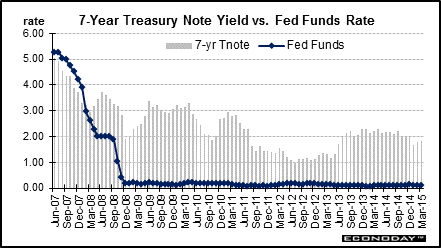
During periods of stability in monetary policy, it is not uncommon to see average yields on 7-year notes to run at least 200 basis points over the fed funds rate target. But this spread can change rapidly when markets are expecting changes in Fed policy. Longer-term rates – such as the 7-year note – tend to be beyond the horizon of Fed easing or tightening. That is, the Fed returns to an average posture before 7 years are up after the expected changes in the fed funds rate. During the latest rate cutting cycle, the Fed cut the fed funds target rate sharply from 5.25 percent in mid-2007 to a range of zero to 0.25 percent on December 16, 2008. The 7-year note rate was below the fed funds target until March 2008. Extremely easy Fed policy has turned the spread positive.
In recent years, the average spread stood at minus 21 basis points in 2006, but fell to minus 52 basis points in 2007 as more investors moved funds into safe havens. The spread bounded back into positive territory in 2008, averaging 124 basis points, reflecting the sharp drop in the fed funds rate. In 2009, the spread surged to 265 basis points on concern about looming supply but slowed afterwards on a sluggish economy and fears over European sovereign debt to 196 basis points in 2012. Expectations of pending Fed tightening pushed the spread in 2014 up to 205 basis points,
Short Term Perspective Rates fell during 2010 on flight to safety and the Fed's quantitative easing adding buying pressure. Inflation fears, a stronger economy, and a search for higher yields lifted rates in early 2011. However, the economy hit a soft patch in late 2011 and in 2012 and sovereign debt fears returned. Initially in early 2013—with hints of an improving economy--the 7-year note yield rose notably. But in spring 2013, softer economic news led to an easing in rates. But in June 2013, concern about the Fed cutting back on its bond buying programs lifted the 7-year yield, rising 40 basis points to 1.71 percent. This put the Treasury-fed funds spread at 161 basis points, compared to 120 the month before. The spread rose in late 2013 and into 2015. In March 2015, the 7-year yield firmed 5 basis points to 1.84 percent.
Values shown reflect monthly averages.
|
|||||||
| Legal Notices | ©Copyright 1998-2024 Econoday, Inc. |
powered by
![[Apple App Store]](/images/AppleAppStore.png) ![[Econoday on Kindle]](/images/kindle.jpg) 
|
||||||